FAQ - General
- 27 Jul 2023
- 6 Minutes to read
- Contributors


- Print
- DarkLight
FAQ - General
- Updated on 27 Jul 2023
- 6 Minutes to read
- Contributors
- Print
- DarkLight
Article Summary
Share feedback
Thanks for sharing your feedback!
Is my data secure with LimaCharlie?
LimaCharlie data is secured starting at the endpoint all the way to your infrastructure. The LimaCharlie platform is hosted on the Google Cloud Platform, leveraging multiple capabilities from credentials management to compute isolation in order to limit the attack surface.
Data access is managed through Google Cloud IAM which is used to isolate various components and customer data. Processing is done in Google Kubernetes Engine which provides an additional layer of container isolation.
Each LimaCharlie data center uses independent cryptographic keys at all layers. Key management uses industry best practices such as key encryption at rest.
LimaCharlie is SOC 2 Type 2 and PCI-DSS compliant. Our infrastructure is housed in ISO 27001 compliant data centres.
Where will my data be processed and stored?
The LimaCharlie global infrastructure is built on the Google Cloud Platform (GCP). Currently, computing resources are available in the USA, Canada, Europe, India, and the United Kingdom. New data centers can be spun up anywhere GCP is available upon request.
When you set up an organization for the first time, you can select the Data Residency Region of your choice:
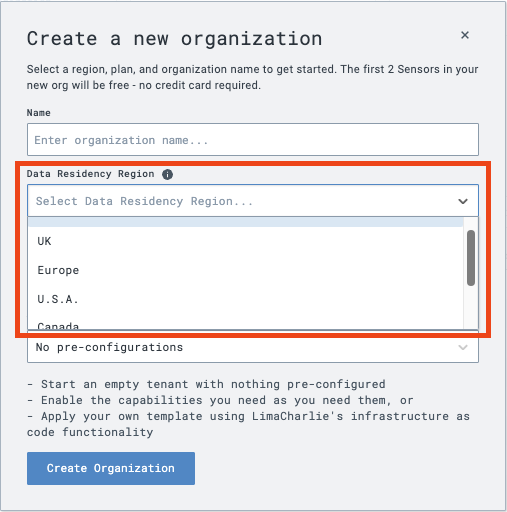
This provides you with the benefit of being able to select which GCP region you want your data in, and have assurance that it will always be processed in this location and never moved outside. This can be important for data residency requirements as it relates to regulatory compliance. For example, if you want to keep all of your information in the US, you can simply select the US region and know that your data will be both processed and stored there.
Need to change the Data Residency Region?
Please note that once a region has been selected for an organization, it cannot be changed later.
Can LimaCharlie staff access my data?
LimaCharlie staff only access your private data when you contact us and give us permission to do so. We will always ask for your permission before we access your private telemetry data.
We consider your sensors and telemetry data to be private and confidential. We understand the tremendous power that is being entrusted to us while we have access to this data. We promise to only access your organization for the exclusive purpose of providing you with the assistance you request from us. We treat your private and confidential information with at least the same due care as we do with our own confidential information, as outlined in our privacy policy.
Will third parties get access to my data?
The only time we provide your data to a third party is with your explicit consent. (e.g. when you set up an Output in LimaCharlie, you're explicitly telling us to send your data to a 3rd party).
What control measures do you have in place to ensure that my data won't be accessed without proper authorizations?
We use transparency as a mitigating control against insider threats. In particular, when we access your organization data, an entry is made to the Audit Log in your organization. You can access the audit log in the web interface and via the API. We also provide the ability for you to send audit log data out of LimaCharlie immediately to a write-only bucket that you control in your own environment.
We use a break-glass system, meaning that LimaCharlie personnel do not have access to customer data by default. This requires an explicit programmatic action (internal to LimaCharlie) that includes its own audit trail that cannot be modified by LimaCharlie staff. This audit trail is regularly reviewed.
LimaCharlie staff access to customer data is restricted to only those who need it to perform their official duties.
We use role-based access control systems to provide granular control over the type of data access granted.
Access to customer organizations is granted programatically as to provide a security control.
We require that our staff undergo a background check and take training, including privacy training, prior to being allowed to access customer data.
We are SOC 2 (Type 2) compliant and a copy of our audit report can be provided upon request.
What is detected by LimaCharlie after it's initially installed?
When the sensor is installed, LimaCharlie will start recording the telemetry. It will not, however, generate detections or take actions to protect the endpoints automatically. As an infrastructure company, we recognize that each environment is different, and one size fits all approach rarely works well. By default, we take the AWS approach - any new organization starts empty, without any pre-configured settings, add-ons, or D&R rules.
Can LimaCharlie be deployed on-premises?
LimaCharlie is a cloud-based solution. The LimaCharlie platform is hosted on the Google Cloud Platform (GCP). There are no limits between AWS & GCP but LimaCharlie is not available on premises; if you configure the sensor on the endpoint, it will connect to the cloud.
Does LimaCharlie detect variants of the latest malware?
When the sensor is installed, LimaCharlie will start recording telemetry. It will not, however, generate detections or take actions to protect the endpoints automatically. As an infrastructure company, we recognize that each environment is different, and one size fits all approach rarely works well. By default, any new organization starts empty, without any pre-configured settings, add-ons, or D&R rules.
LimaCharlie makes it easy to add a detection & response rule as soon as new variants of malware are discovered. This way, you are in a full control of your coverage and there is no need to wait for a vendor to come up with a new detection rule.
What latency can I expect in LimaCharlie?
LimaCharlie Detection & Response (D&R) engine has very low latency and you can expect that responses are almost instantaneous (e.g. 100ms).
You may notice some latency as it relates to outputs. Some of our outputs are done in batches, such as Amazon S3, SFTP, Google Cloud Storage. You can configure the maximum size and maximum time for these outputs. We also offer live outputs, such as Syslog.
How can I integrate LimaCharlie with my existing SIEM?
The most common use case we see is sending detections and events data from LimaCharlie into the SIEM.
To do it, you will need to configure outputs. Here are some examples for configuring outputs to go to an email or to Chronicle.
Remember to select the type of data forwarded by this configuration (stream). The available options are as follows:
- event: Contains all events coming back from sensors (not cloud detections). It is very verbose.
- detect: Contains all detections reported from D&R rules or subscriptions. This is the option you would choose if you want detections to generate emails (you would also need to ensure that D&R rules are configured to generate detections).
- audit: Contains auditing events about activity around the management of the platform in the cloud.
- deployment: Contains all "deployment" events like sensor enrollment, cloned sensors etc.
- artifact: Contains all "artifact" events of files collected through the Artifact Collection mechanism.
While sending detections and events data from LimaCharlie into the SIEM is the most common way we see our users set up the integration between these two systems, you can also bring in the data into LimaCharlie from SIEM or build other custom workflows. Contact our support team if you need help with your use case or if you have further questions.
What is the retention policy for management/audit logs?
LimaCharlie stores management/audit logs for one year.
We suggest you set up an Output to send logs to an external destination if you are looking to have your logs stored for over one year.
Does LimaCharlie offer reporting capabilities?
It is very common for users to bring different log, network and endpoint data into the LimaCharlie to leverage our detection and response, advanced correlation and storage. If you wish to leverage data visualization capabilities, we make it easy to send the data you need to Splunk, Tableau or any other solution of your choice via public API.
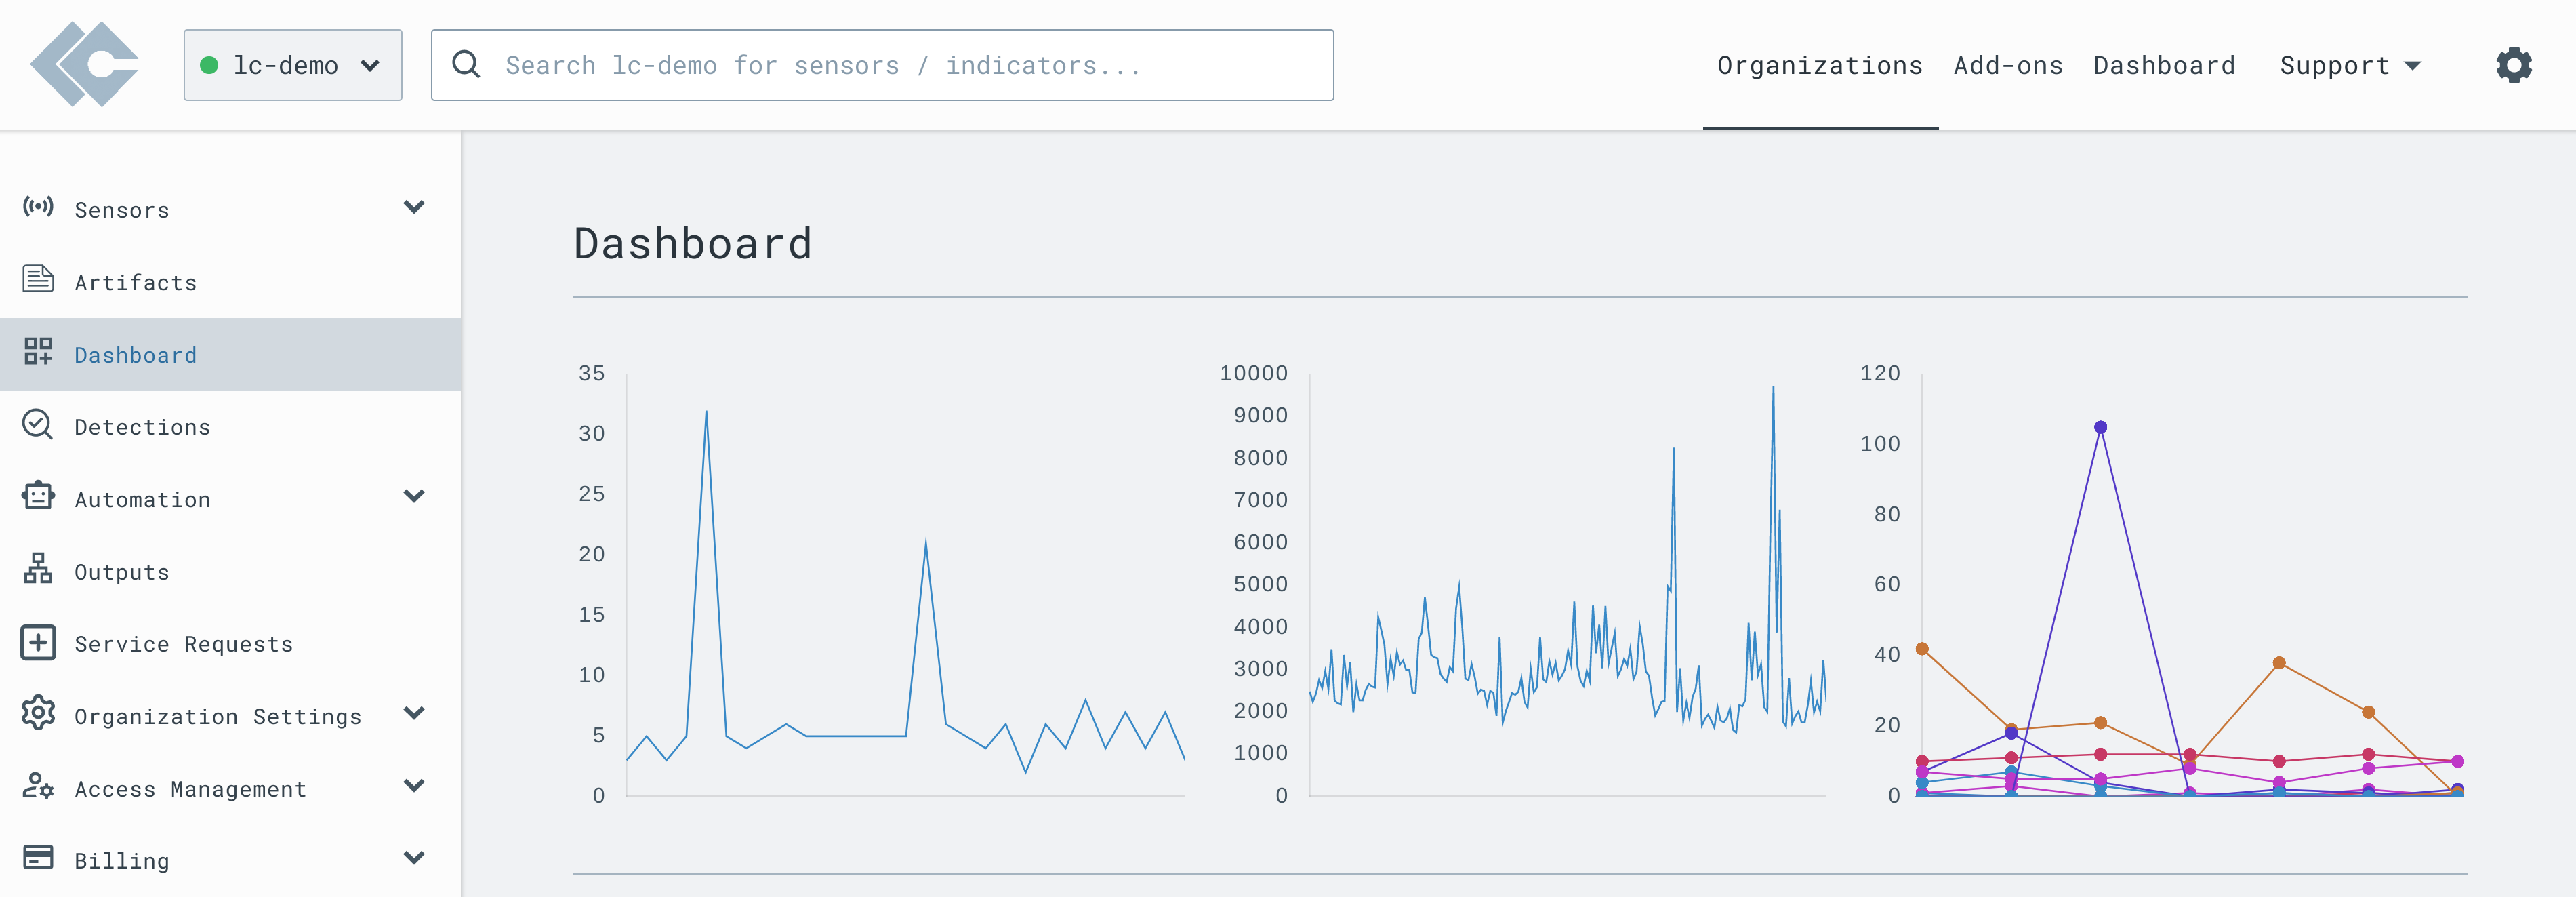
In LimaCharlie web app, you can track information such as detections and events over time and number of sensors online.
Was this article helpful?